Showing posts with label Python. Show all posts
Step 1: Install Required Libraries
You will need captcha for generating CAPTCHA images, and pytesseract (OCR tool) to read the text from the images.
Install them via pip:
Step 2: Generate CAPTCHA Image Using ImageCaptcha
First, let's see how to generate a simple CAPTCHA image using the captcha library.
Example Code to Generate CAPTCHA:
Step 3: Read CAPTCHA Image Using OCR (pytesseract)
Now that you've generated a CAPTCHA image, you can use pytesseract to read the text from the image.
Example Code to Read CAPTCHA:
Read and Generate Image Captcha using Python
>>> import cowsay

>>> cowsay.cow('Hello World')
 ___________
| Hello World |
  ===========
           \
            \
              ^__^
              (oo)\_______
              (__)\       )\/\
                  ||----w |
                  ||     ||
>>> cowsay.cow('Lorem ipsum dolor sit amet, consectetur adipiscing elit. Mauris blandit rhoncus nibh. Mauris mi mauris, molestie vel metus sit amet, aliquam vulputate nibh.')Create Animal picture with 2 lines of code in Python
What Is Streamlit?
Streamlit is a free and open-source framework to rapidly
build and share beautiful machine learning and data science web apps.
It is a Python-based library specifically designed for
machine learning engineers. Data scientists or machine learning engineers are
not web developers and they're not interested in spending weeks learning to use
these frameworks to build web apps. Instead, they want a tool that is easier to
learn and to use, as long as it can display data and collect needed parameters
for modeling.
Streamlit allows you to create a stunning-looking
application with only a few lines of code.

Why should data scientists use Streamlit?
The best thing about Streamlit is that you don't even need
to know the basics of web development to get started or to create your first
web application. So if you're somebody who's into data science and you want to
deploy your models easily, quickly, and with only a few lines of code,
Streamlit is a good fit.
One of the important aspects of making an application
successful is to deliver it with an effective and intuitive user interface.
Many of the modern data-heavy apps face the challenge of building an effective
user interface quickly, without taking complicated steps. Streamlit is a
promising open-source Python library, which enables developers to build
attractive user interfaces in no time.
Streamlit is the easiest way especially for people with no
front-end knowledge to put their code into a web application:
- No
front-end (html, js, css) experience or knowledge is required.
- You
don't need to spend days or months to create a web app, you can create a
really beautiful machine learning or data science app in only a few hours
or even minutes.
- It is
compatible with the majority of Python libraries (e.g. pandas, matplotlib,
seaborn, plotly, Keras, PyTorch, SymPy(latex)).
- Less
code is needed to create amazing web apps.
- Data
caching simplifies and speeds up computation pipelines.
How to use Streamlit
Install Streamlit
On Windows:
1. Install Anaconda and create your environment
2. Open the terminal

3. Type this command in the terminal to install Streamlit:
pip install streamlit
4. Test if the installation worked:
streamlit hello

When you type this command in the terminal, the page below
should open automatically:

On macOS:
1. Install pip:
sudo easy_install pip
2. Install pipenv:
pip3 install pipenv
3. Create your environment. Open your project folder:
cd project_folder_name
4. Create a pipenv environment:
pipenv shell
5. Type this command to install Streamlit:
pip install streamlit
Test if the installation worked:
streamlit hello
On Linux:
1. Install pip:
sudo apt-get install python3-pip
2. Install pipenv:
pip3 install pipenv
3. Create your environment. Open your project folder:
cd project_folder_name
4. Create a pipenv environment:
pipenv shell
5. Type this command to install Streamlit
pip install streamlit
6. Test if the installation worked:
streamlit hello
How to run your Streamlit code
streamlit run file_name.py

Streamlit commands are easy to write and understand. With
just a simple command, you are able to display texts, media, widgets, graphs,
etc.
Display texts with Streamlit
In the beginning, we will see how to add text to your
Streamlit app, and what the different commands are to add texts.
st.write(): This function is used to add anything to a web
app, from formatted string to charts in matplotlib figure, Altair charts,
plotly figure, data frame, Keras model, and others.
import streamlit as stst.write("Hello ,let's learn how
to build a streamlit app together")

st.title(): This function allows you to add the title of the
app. st.header(): This function is used to set header of a section. st.markdown():
This function is used to set a markdown of a section. st.subheader(): This
function is used to set sub-header of a section. st.caption(): This
function is used to write caption. st.code(): This function is used to set
a code. st.latex(): This function is used to display mathematical
expressions formatted as LaTeX.
import streamlit as st
st.title("This is the app title")
st.header("This is the header")
st.markdown("This is the markdown")
st.subheader("This is the subheader")
st.caption("This is the caption")
st.code("x
= 2021")
st.latex(r'''
a+a r^1+a r^2+a r^3 ''')

Display an image, video or audio file with Streamlit
You can't find functions as easy as Streamlit functions to
display images, videos, and audio files. Let's take a look at how to display
media with Streamlit !
st.image(): This function is used to display an image. st.audio():
This function is used to display an audio. st.video(): This function is
used to display a video.
st.image("kid.jpg", caption="A kid
playing")
st.audio("audio.mp3")
st.video("video.mp4")

Input widgets
Widgets are the most important user interface components.
Streamlit has various widgets that allow you to bake interactivity directly
into your apps with buttons, sliders, text inputs, and more.
st.checkbox(): This function returns a Boolean value. When
the box is checked, it returns a True value, otherwise a False value. st.button():
This function is used to display a button widget. st.radio(): This
function is used to display a radio button widget. st.selectbox(): This
function is used to display a select widget. st.multiselect(): This
function is used to display a multiselect widget. st.select_slider(): This
function is used to display a select slider widget. st.slider(): This
function is used to display a slider widget.
st.checkbox('Yes')
st.button('Click Me')
st.radio('Pick your gender', ['Male', 'Female'])
st.selectbox('Pick a fruit', ['Apple', 'Banana', 'Orange'])
st.multiselect('Choose a planet', ['Jupiter', 'Mars', 'Neptune'])
st.select_slider('Pick a mark', ['Bad', 'Good', 'Excellent'])
st.slider('Pick a number', 0, 50)

st.number_input(): This function is used to display a
numeric input widget. st.text_input(): This function is used to display a
text input widget. st.date_input(): This function is used to display a
date input widget to choose a date. st.time_input(): This function is used
to display a time input widget to choose a time. st.text_area(): This
function is used to display a text input widget with more than a line
text. st.file_uploader(): This function is used to display a file uploader
widget. st.color_picker(): This function is used to display color picker
widget to choose a color.
st.number_input('Pick a number', 0, 10)
st.text_input('Email address')
st.date_input('Traveling date')
st.time_input('School time')
st.text_area('Description')
st.file_uploader('Upload a photo')
st.color_picker('Choose your favorite color')

Display progress and status with Streamlit
Now we will see how we can add a progress bar and status
messages such as error and success to our app.
st.balloons(): This function is used to display balloons for
celebration. st.progress(): This function is used to display a progress
bar. st.spinner(): This function is used to display a temporary waiting
message during execution.
st.balloons() #
Celebration balloons
st.progress(10) #
Progress bar
with st.spinner('Wait for it...'):
time.sleep(10) # Simulating a process delay

st.success(): This function is used to display a success
message. st.error(): This function is used to display an error
message. st.warnig(): This function is used to display a warning
message. st.info(): This function is used to display an informational
message. st.exception(): This function is used to display an exception
message.
st.success("You did it!")
st.error("Error occurred")
st.warning("This is a warning")
st.info("It's easy to build a Streamlit app")
st.exception(RuntimeError("RuntimeError exception"))

Sidebar and container
You can also create a sidebar or a container on your page to
organize your app. The hierarchy and arrangement of pages on your app can have
a large impact on your user experience. By organizing your content, you allow
visitors to understand and navigate your site, which helps them find what
they're looking for and increases the likelihood that they'll return in the
future.
Sidebar
Passing an element to st.sidebar() will make this
element pinned to the left, allowing users to focus on the content in your app.
But st.spinner() and st.echo() are not
supported with st.sidebar.
As you see, you can create a sidebar in your app interface
and put elements inside it that will make your app more organized and easier to
understand.
st.sidebar.title("Sidebar Title")
st.sidebar.markdown("This is the sidebar content")

Container
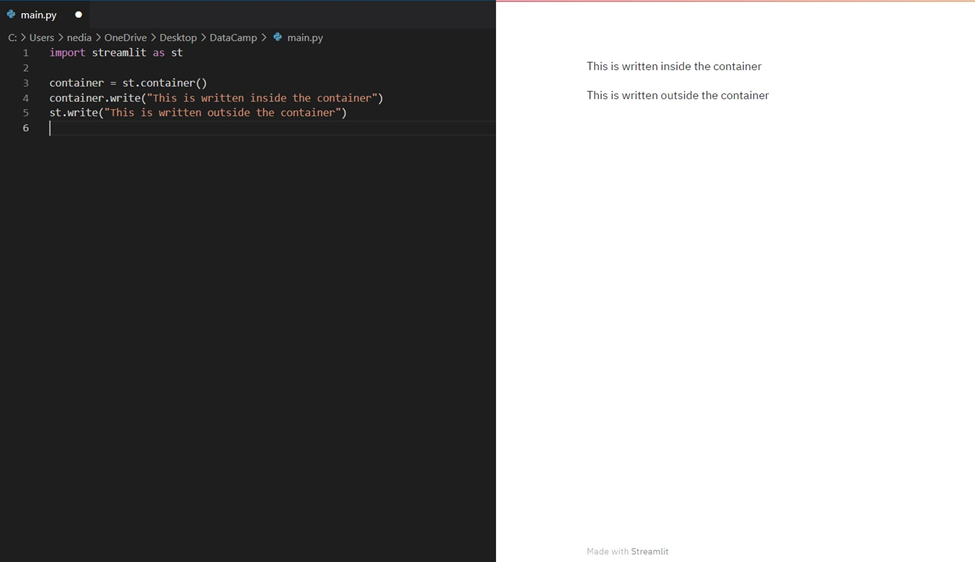
st.container() is used to create an invisible container
where you can put elements in order to create a useful arrangement and
hierarchy.
with st.container():
st.write("This
is inside the container")
Display graphs with Streamlit
Why do we need visualization?
Data visualization helps to tell stories by curating data
into a format that's easier to understand, highlighting the trends and
outliers. A good visualization tells a story, removing the noise from data and
highlighting the useful information. However, it's not simply as easy as
dressing up a graph to make it look better or slapping on the "info"
part of an infographic. Effective data visualization is a delicate balancing
act between form and function. The plainest graph could be too boring to draw
attention or convey a powerful message, and the most stunning visualization
could utterly fail at conveying the right message. The data and the visuals
need to work together, and there's an art to combining great analysis with
great storytelling.
Do you think giving you the data of one million points in a
table/database file and asking you to provide your inferences by just seeing
the data on that table is feasible? Unless you're a super human, it's not
possible. This is when we make use of data visualization—it gives us a clear
idea of what the information means by giving it visual context through maps or
graphs. That's the power of Streamlit visualization.
st.pyplot(): This function is used to display a
matplotlib.pyplot figure.
import streamlit as st
import matplotlib.pyplot as plt
import numpy as np
rand = np.random.normal(1, 2, size=20)
fig, ax = plt.subplots()
ax.hist(rand, bins=15)
st.pyplot(fig)

st.line_chart(): This function is used to display a line
chart.
import streamlit as st
import pandas as pd
import numpy as np
df = pd.DataFrame(np.random.randn(10, 2), columns=['x', 'y'])
st.line_chart(df)

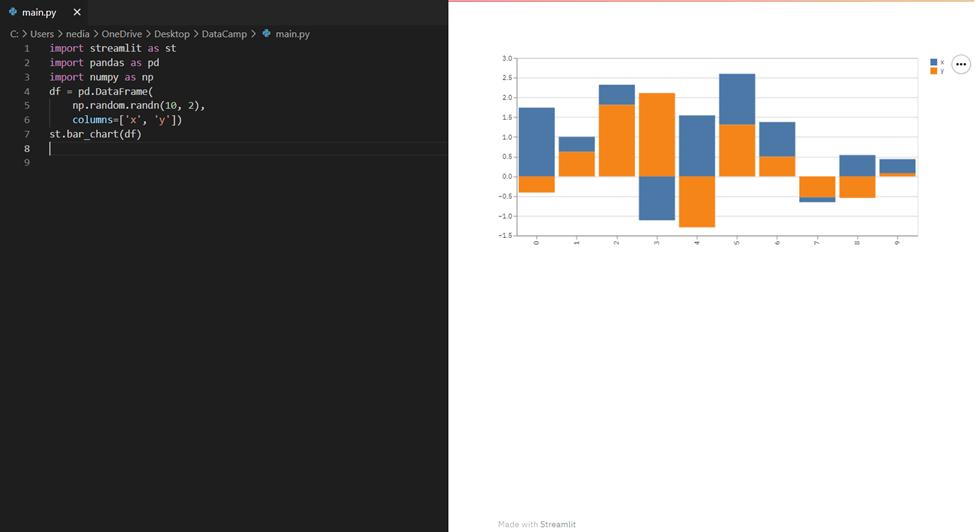
st.bar_chart(): This function is used to display a bar
chart.
import streamlit as st
import pandas as pd
import numpy as np
df = pd.DataFrame(np.random.randn(10, 2), columns=['x', 'y'])
st.bar_chart(df)
st.area_chart(): This function is used to display an area
chart.
import streamlit as st
import pandas as pd
import numpy as np
df = pd.DataFrame(np.random.randn(10, 2), columns=['x', 'y'])
st.area_chart(df)

st.altair_chart(): This function is used to display an
altair chart.
import streamlit as st
import pandas as pd
import numpy as np
import altair as alt
df = pd.DataFrame(np.random.randn(500, 3), columns=['x', 'y',
'z'])
chart = alt.Chart(df).mark_circle().encode(
x='x', y='y', size='z',
color='z', tooltip=['x', 'y', 'z']
)
st.altair_chart(chart, use_container_width=True)

st.graphviz_chart(): This function is used to display graph
objects, which can be completed using different nodes and edges.
import streamlit as st
import graphviz
st.graphviz_chart('''
digraph {
Big_shark
-> Tuna
Tuna ->
Mackerel
Mackerel ->
Small_fishes
Small_fishes
-> Shrimp
}
''')

Display maps with Streamlit
st.map(): This function is used to display maps in the app.
However, it requires the values of latitude and longitude and these values
should not be null/NA.
import pandas as pd
import numpy as np
import streamlit as st
df = pd.DataFrame(
np.random.randn(500,
2) / [50, 50] + [37.76, -122.4], columns=['lat', 'lon']
)
st.map(df)

Themes
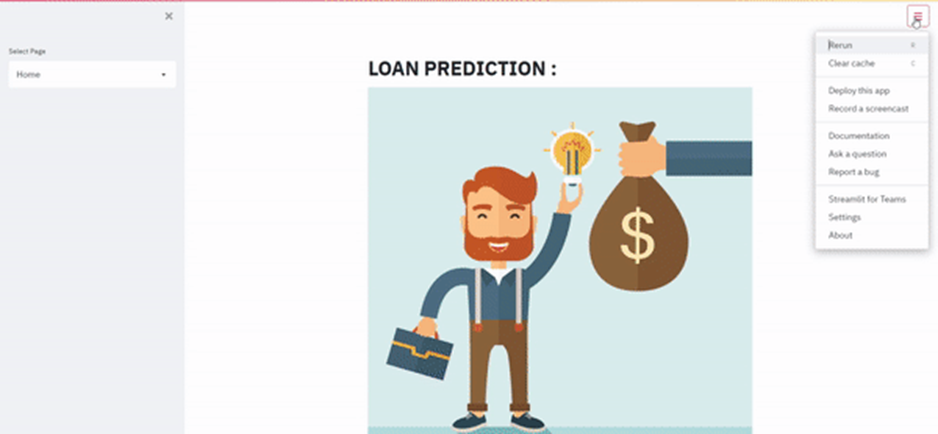
You can also choose a theme that reflects your style. Follow
the steps in the GIF below:
And if you are interested in learning more about styling and
themes, you can take a look at Theming.
Now, it's time to build an app together!
Build a machine learning application
In this section, I will walk you through a project I made
about loan prediction.
The main profit of loans comes directly from the loan's
interest. The loan companies grant a loan after an intensive process of
verification and validation. However, they still don't have assurance if the
applicant is able to repay the loan with no difficulties. In this tutorial, we
will build a predictive model (Random Forest Classifier) to predict the loan
status of an applicant. Our mission is to prepare a web app to make it
available in production.
Starting with importing the necessary libraries for our app:
import streamlit as st
import pandas as pd
import numpy as np
import pickle # to
load a saved model
import base64 # to
handle gif encoding
In this app, we will use multiple widgets as sliders:
selectbox and radio in the sidebar menu, for which we will prepare some Python
functions.The example will be a simple demo that has two pages. On the
homepage, it will show the data that we selected, whereas the Exploration page
will allow you to visualize variables in plots, and the Prediction page will
contain variables with a button named Predict that will allow you to estimate
the loan status. The code below gives you a selectbox on the sidebar which
allows you to select a page. The data is cached so that it does not need to
reload constantly.
@st.cache is a caching mechanism that allows your app
to stay performant even when loading data from the web, manipulating large
datasets, or performing expensive computations.
@st.cache
def get_fvalue(val):
feature_dict = {"No":
1, "Yes": 2}
return
feature_dict[val]
def get_value(val, my_dict):
return my_dict[val]

In the Home page, we will visualize: presentation picture /
the dataset / histogram of applicant income and loan amount.
Note: We will use if/elif/else to switch between pages.
We will load the loan_dataset.csv in variable data that will
allow us to show a few lines of it in the Home page.
if app_mode == 'Home':
st.title('Loan
Prediction')
st.image('loan_image.jpg')
st.markdown('Dataset:')
data = pd.read_csv('loan_dataset.csv')
st.write(data.head())
st.bar_chart(data[['ApplicantIncome',
'LoanAmount']].head(20))

Then in the Prediction page:
if app_mode == 'Prediction':
ApplicantIncome =
st.sidebar.slider('ApplicantIncome', 0, 10000, 0)
LoanAmount = st.sidebar.slider('LoanAmount
in K$', 9.0, 700.0, 200.0)
# Assuming
additional input features here...
# Prediction Logic
if st.button("Predict"):
loaded_model =
pickle.load(open('Random_Forest.sav', 'rb'))
prediction =
loaded_model.predict(np.array([ApplicantIncome, LoanAmount]).reshape(1, -1))
if prediction[0]
== 0:
st.error('According
to our calculations, you will not get the loan.')
else:
st.success('Congratulations!
You will get the loan.')
We wrote two functions get_value(val,my_dict) and get_fvalue(val) and
dictionaries as feature_dict to manipulate st.sidebar.radio() with
non-numeric variables. It's optional, you can easily do something like this:

Let's see why we did that.
Note: Machine learning algorithms cannot handle categorical
variables. In the dataset, I did some feature engineering. For example, the
column Married has two variables 'Yes' and 'No' and I did a Label Encoding (
Take a look to better understand ) so "NO" will be equal to 1 and
"Yes" to 2. The function get_fvalue(val) will easily return the value
(1/2) depending what the client has chosen. Same for the function
get_value(val,my_dict) . The difference between the two functions is that the
first works on yes/no features and the second one is in the general case when
we have multiple variables ( example: Gender ).
As we can see the variable Dependents has four categories
'0','1' , '2' and '3+' and we cannot convert something like that into a numeric
variable, and we have '+3' that means Dependents can take 3,4,5 ... We did a
One Hot Enconding ( Take a look to better understand ) Thus , we created a
sidebar radio containing the four elements and each one has a binary variable,
if the client chose '0' class_0 will be equal to 1 and the others will be equal
to 0.

Also we did One Hot Encoding for Property_Area that's why we
created 3 variables (Rural,Urban,Semiurban) ,When Rural takes 1 the others will
be equal to 0.

So we have seen both—when we label or one hot encoding our
features and how to deal with it to successfully created a working Streamlit
app.
data1={ 'Gender':Gender, 'Married':Married, 'Dependents':[class_0,class_1,class_2,class_3], 'Education':Education, 'ApplicantIncome':ApplicantIncome, 'CoapplicantIncome':CoapplicantIncome, 'Self Employed':Self_Employed, 'LoanAmount':LoanAmount, 'Loan_Amount_Term':Loan_Amount_Term, 'Credit_History':Credit_History, 'Property_Area':[Rural,Urban,Semiurban], }
feature_list=[ApplicantIncome,CoapplicantIncome,LoanAmount,Loan_Amount_Term,Credit_History,get_value(Gender,gender_dict),get_fvalue(Married),data1['Dependents'][0],data1['Dependents'][1],data1['Dependents'][2],data1['Dependents'][3],get_value(Education,edu),get_fvalue(Self_Employed),data1['Property_Area'][0],data1['Property_Area'][1],data1['Property_Area'][2]] single_sample = np.array(feature_list).reshape(1,-1)
Now we will store our variables in a dictionary because we
wrote get_value(val,my_dict) and get_fvalue(val) to deal
with dictionaries. After that, the input—what the client will choose as input
in our Streamlit app—will be arranged in a list named feature_list then
to a numpy variable named single_sample.
Note: The inputs of features must be arranged in the same
order of dataset columns (e.g. Married cannot take the input of Gender).
if st.button("Predict"): file_ = open("6m-rain.gif", "rb") contents = file_.read() data_url = base64.b64encode(contents).decode("utf-8") file_.close() file
= open("green-cola-no.gif", "rb") contents = file.read() data_url_no = base64.b64encode(contents).decode("utf-8") file.close() loaded_model = pickle.load(open('Random_Forest.sav',
'rb')) prediction = loaded_model.predict(single_sample) if prediction[0] == 0 : st.error( 'According to our Calculations, you will
not get the loan from Bank' ) st.markdown( f'<img src="data:image/gif;base64,{data_url_no}"
alt="cat gif">',
unsafe_allow_html=True,) elif
prediction[0] == 1 : st.success( 'Congratulations!! you will get the loan
from Bank' ) st.markdown( f'<img src="data:image/gif;base64,{data_url}"
alt="cat gif">',
unsafe_allow_html=True, )
Finally, we will load our saved RandomForestClassifier model
in loaded_model and its prediction, which is 0 or 1 (classification
problem) in prediction. The .gif files will be stored in file and file_.
Depending on the value of prediction, we will have two cases,
"Success" or "Failed," to get a loan from the bank.
This is our Prediction page:

In the case of FAILURE, the output will look like this:

In the case of SUCCESS, the output will look like this:

How to use Streamlit Python with solving machine Learning Problem
In Python programming, dictionaries are incredibly versatile, allowing you to store data in key-value pairs for efficient management and access. If you are new to Python, understanding how to manipulate these dictionaries is important, as it will greatly enhance how you handle data across various applications. Whether you are configuring settings, managing complex datasets, or simply storing data for quick lookup, dictionaries are your answer.
What is a Python dictionary?
A dictionary in Python is a collection of key-value pairs.
Each key in a dictionary is unique and maps to a value, which can be of any
data type (such as strings, integers, lists, or even other dictionaries). This
structure allows for retrieval, addition, and modification of data. Here’s a
simple example of a Python dictionary:
# Example of a dictionary
person = {
'name': 'Alice',
'age': 25,
'city': 'New York'
}
# Accessing a value
print(person['name'])
# Output: Alice
In this example, 'name', 'age', and 'city' are keys, and 'Alice',
25, and 'New York' are their corresponding values.
Structure of a Python dictionary
Dictionaries are unordered collections, which means the
items do not have a defined order. However, starting from Python 3.7,
dictionaries maintain the insertion order, which can be useful in various
applications. Here’s a more detailed example to illustrate the structure:
# A more complex dictionary
employee = {
'id': 101,
'name': 'John Doe',
'age': 30,
'department': 'Engineering',
'skills': ['Python',
'Machine Learning', 'Data Analysis'],
'address': {
'street': '123
Main St',
'city': 'San
Francisco',
'state': 'CA',
'zip': '94105'
}
}
# Accessing nested data
print(employee['skills'][1])
# Output: Machine Learning
print(employee['address']['city']) # Output: San Francisco
In this example, the employee dictionary contains various
types of data, including a list ('skills') and another dictionary ('address').
This demonstrates how dictionaries can be used to store and organize complex
data structures.
Methods to Append Elements to a Dictionary in Python
Appending elements to a dictionary is a common task in
Python, and there are several methods to do this, each with its own use cases
and advantages. Let’s go through them one by one.
Using square bracket notation
The most straightforward way to add a single key-value pair
to a dictionary is using square bracket notation. This method is simple and
efficient for adding individual elements. Here is the syntax:
dictionary[key] = value
Here’s an example using the square bracket notation:
# Initialize a dictionary
my_dict = {'name': 'Alice', 'age': 25}
# Add a new key-value pair
my_dict['city'] = 'New York'
# Print the updated dictionary
print(my_dict)
# Output: {'name': 'Alice', 'age': 25, 'city': 'New York'}
This method directly adds or updates the key-value pair in
the dictionary. If the key already exists, its value will be updated.
When you use square bracket notation to add a key that
already exists in the dictionary, the value associated with that key is
updated. This can be both a feature and a caveat, depending on your needs.
Here’s an example demonstrating how to handle existing keys:
# Update an existing key-value pair
my_dict['age'] = 30
# Print the updated dictionary
print(my_dict)
# Output: {'name': 'Alice', 'age': 30, 'city': 'New York'}
In this example, the value of the key 'age' is updated from 25
to 30.
Using the .update() method
The .update() method allows you to add multiple key-value
pairs to a dictionary in one go. It can accept another dictionary or an
iterable of key-value pairs. Here is the syntax:
dictionary.update(other)
Here’s an example using the .update() method:
# Initialize a dictionary
my_dict = {'name': 'Alice', 'age': 25}
# Add new key-value pairs using update()
my_dict.update({'city': 'New York', 'email': 'alice@example.com'})
# Print the updated dictionary
print(my_dict)
# Output: {'name': 'Alice', 'age': 25, 'city': 'New York',
'email': 'alice@example.com'}
The .update() method can also be used with an iterable of
key-value pairs. Here’s an example:
# Initialize a dictionary
my_dict = {'name': 'Alice', 'age': 25}
# Add new key-value pairs using update() with an iterable
my_dict.update([('city', 'New York'), ('email', 'alice@example.com')])
# Print the updated dictionary
print(my_dict)
# Output: {'name': 'Alice', 'age': 25, 'city': 'New York',
'email': 'alice@example.com'}
The .update() method is particularly useful when you need to
update the dictionary with several new entries simultaneously. If a key already
exists, its value will be updated.
Using the .setdefault() method
The .setdefault() method is used to add a key-value pair to
a dictionary only if the key does not already exist. If the key exists, it
returns the existing value. Here is the syntax:
dictionary.setdefault(key, default_value)
Here is an example using the .setdefault() method:
# Initialize a dictionary
my_dict = {'name': 'Alice', 'age': 25}
# Use setdefault to add a new key-value pair
my_dict.setdefault('city', 'New York')
# Attempt to add an existing key
my_dict.setdefault('age', 30)
# Print the updated dictionary
print(my_dict)
# Output: {'name': 'Alice', 'age': 25, 'city': 'New York'}
In this example, the .setdefault() method adds the 'city'
key with the value 'New York' because it did not already exist in the
dictionary. When trying to add the 'age' key, it does not change the existing
value 25 because the key already exists.
This approach is suitable when you need to ensure that a key
has a default value if it does not exist. It can be also used when you want to
add new key-value pairs without overwriting existing ones.
Using the dict() constructor
You can also create a new dictionary with additional
key-value pairs using the dict() constructor. This approach is useful when you
want to create a new dictionary based on an existing one. Here is the syntax:
new_dict = dict(existing_dict, key1=value1, key2=value2)
Here is an example using the dict() constructor:
# Initialize a dictionary
my_dict = {'name': 'Alice', 'age': 25}
# Create a new dictionary with additional key-value pairs
new_dict = dict(my_dict, city='New York', email='alice@example.com')
# Print the new dictionary
print(new_dict)
# Output: {'name': 'Alice', 'age': 25, 'city': 'New York',
'email': 'alice@example.com'}
In this example, the dict() constructor is used to create a
new dictionary new_dict that includes the original key-value pairs from my_dict
and the additional key-value pairs 'city': 'New York' and 'email':
'alice@example.com'.
This approach is good when you want to create a new
dictionary by combining existing dictionaries and additional key-value pairs.
It can also be used when you need to create a new dictionary with some
modifications while keeping the original dictionary unchanged.
Comparison table
Here’s a quick reference table for the methods we covered in
our tutorial:
|
Method |
Use
Case |
Example |
|
Square
Bracket |
Single
key-value pair |
dict[key]
= value |
|
.update() |
Multiple
key-value pairs |
dict.update({key1:
value1, key2: value2}) |
|
.setdefault() |
Add
key-value pair only if key does not exist |
dict.setdefault(key,
default_value) |
|
dict()
constructor |
Create
a new dictionary or update an existing one with additional key-value pairs |
new_dict
= dict(existing_dict, key1=value1, key2=value2) |
Appending to lists within a dictionary
Often, dictionaries are used to store lists as values.
Appending elements to these lists requires a slightly different approach.
Here’s how you can do it using .append():
# Initialize a dictionary with a list as a value
dictionary_w_list = {'fruits': ['apple', 'banana']}
# Append an element to the list within the dictionary
dictionary_w_list['fruits'].append('cherry')
# Print the updated dictionary
print(dictionary_w_list)
# Output: {'fruits': ['apple', 'banana', 'cherry']}
In this example, we start with dictionary_w_list where the
key 'fruits' maps to a list ['apple', 'banana']. By using the .append() method,
we add 'cherry' to the list. This technique is particularly useful when
managing collections of items within a single dictionary.
Combining dictionaries with the merge operator
Python 3.9 introduced the merge operator (|) for combining
dictionaries. This operator allows you to merge two dictionaries into a new one
effortlessly:
# Initialize two dictionaries
first_dictionary = {'name': 'Alice', 'age': 25}
second_dictionary = {'city': 'New York', 'email': 'alice@example.com'}
# Merge the dictionaries using the merge operator
merged_dictionary = first_dictionary | second_dictionary
# Print the merged dictionary
print(merged_dictionary)
# Output: {'name': 'Alice', 'age': 25, 'city': 'New York',
'email': 'alice@example.com'}
Using the update operator
For in-place updates, Python 3.9 also introduced the update |=
operator. This operator allows you to update the original dictionary with the
key-value pairs from another dictionary.
# Initialize two dictionaries
first_dictionary = {'name': 'Alice', 'age': 25}
second_dictionary = {'city': 'New York', 'email': 'alice@example.com'}
# Update dict1 in-place using the update |= operator
first_dictionary |= second_dictionary
# Print the updated dictionary
print(first_dictionary)
# Output: {'name': 'Alice', 'age': 25, 'city': 'New York',
'email': 'alice@example.com'}
Here, the update |= operator updates first_dictionary with
the contents of second_dictionary in place. What this means is that first_dictionary
is directly modified. This method is particularly useful when you need to
update an existing dictionary without creating a new one.
Conclusion
In this article, we have learned about Python dictionaries
and the methods for appending key-value pairs. We started with fundamental
techniques like using square bracket notation and the .update() method, which
is essential for quick and straightforward updates. We then moved on to more
advanced techniques, including appending to lists within dictionaries, merging
dictionaries with the merge operator (|), and performing in-place updates with
the update |= operator. These methods provide powerful tools for managing
complex data structures and performing efficient operations.
How to use Python Dictionary with different Methods
Importing a CSV file using the read_csv() function
Before reading a CSV file into a pandas dataframe, you should have some insight into what the data contains. Thus, it’s recommended you skim the file before attempting to load it into memory: this will give you more insight into what columns are required and which ones can be discarded.
Let’s write some code to import a file using read_csv(). Then we can talk about what’s going on and how we can customize the output we receive while reading the data into memory.
import pandas as pd # Read the CSV file airbnb_data = pd.read_csv("data/listings_austin.csv") # View the first 5 rows airbnb_data.head()

All that has gone on in the code above is we have:
- Imported the pandas library into our environment
- Passed the filepath to
read_csvto read the data into memory as a pandas dataframe. - Printed the first five rows of the dataframe.
But there’s a lot more to the read_csv()function.
Setting a column as the index
The default behavior of pandas is to add an initial index to the dataframe returned from the CSV file it has loaded into memory. However, you can explicitly specify what column to make as the index to the read_csv function by setting the index_col parameter.
Note the value you assign to index_col may be given as either a string name, column index or a sequence of string names or column indexes. Assigning the parameter a sequence will result in a multiIndex (a grouping of data by multiple levels).
Let’s read in the data again and set the id column as the index.
# Setting the id column as the index airbnb_data = pd.read_csv("data/listings_austin.csv", index_col="id") # airbnb_data = pd.read_csv("data/listings_austing.csv", index_col=0) # Preview first 5 rows airbnb_data.head()

Selecting specific columns to read into memory
What if you only want to read specific columns into memory because not all of them are important? This is a common scenario that occurs in the real world. Using the read_csv function, you can select only the columns you need after loading the file, but this means you must know what columns you need prior to loading in the data if you wish to perform this operation from within the read_csv function.
If you do know the columns you need, you’re in luck; you can save time and memory by passing a list-like object to the usecols parameter of the read_csv function.
# Defining the columns to read usecols = ["id", "name", "host_id", "neighbourhood", "room_type", "price", "minimum_nights"] # Read data with subset of columns airbnb_data = pd.read_csv("data/listings_austin.csv", index_col="id", usecols=usecols) # Preview first 5 rows airbnb_data.head()

We have barely scratched the surface of different ways to customize the output of the read_csv function, but going into more depth would certainly be an information overload.
Reading Data from a URL
Once you know how to read a CSV file from local storage into memory, reading data from other sources is a breeze. It’s ultimately the same process, except that you’re no longer passing a file path.
Let’s say there’s data you want from a specific webpage; how would you read it into memory?
We will use the Iris dataset from the UCI repository as an example:
# Webpage URL url = "https://archive.ics.uci.edu/ml/machine-learning-databases/iris/iris.data" # Define the column names col_names = ["sepal_length_in_cm", "sepal_width_in_cm", "petal_length_in_cm", "petal_width_in_cm", "class"] # Read data from URL iris_data = pd.read_csv(url, names=col_names) iris_data.head()

Voila!
You may have noticed we assigned a list of strings to the names parameter in the read_csv function. This is just so we can rename the column headers while reading the data into memory.
Methods and Attributes of the DataFrame Structure
The most common object in the pandas library is, by far, the dataframe object. It’s a 2-dimensional labeled data structure consisting of rows and columns that may be of different data types (i.e., float, numeric, categorical, etc.).
Conceptually, you can think of a pandas dataframe like a spreadsheet, SQL table, or a dictionary of series objects – whichever you’re more familiar with. The cool thing about the pandas dataframe is that it comes with many methods that make it easy for you to become acquainted with your data as quickly as possible.
You have already seen one of those methods: iris_data.head(), which shows the first n (the default is 5) rows. The “opposite” method of head() is tail(), which shows the last n (5 by default) rows of the dataframe object. For example:
iris_data.tail()

You can quickly discover the column names by using the columns attribute on your dataframe object:
# Discover the column names iris_data.columns """ Index(['sepal_length_in_cm', 'sepal_width_in_cm', 'petal_length_in_cm', 'petal_width_in_cm', 'class'], dtype='object') """
Another important method you can use on your dataframe object is info(). This method prints out a concise summary of the dataframe, including information about the index, data types, columns, non-null values, and memory usage.
# Get summary information of the dataframe iris_data.info() """ <class 'pandas.core.frame.DataFrame'> RangeIndex: 150 entries, 0 to 149 Data columns (total 5 columns): # Column Non-Null Count Dtype --- ------ -------------- ----- 0 sepal_length_in_cm 150 non-null float64 1 sepal_width_in_cm 150 non-null float64 2 petal_length_in_cm 150 non-null float64 3 petal_width_in_cm 150 non-null float64 4 class 150 non-null object dtypes: float64(4), object(1) memory usage: 6.0+ KB """
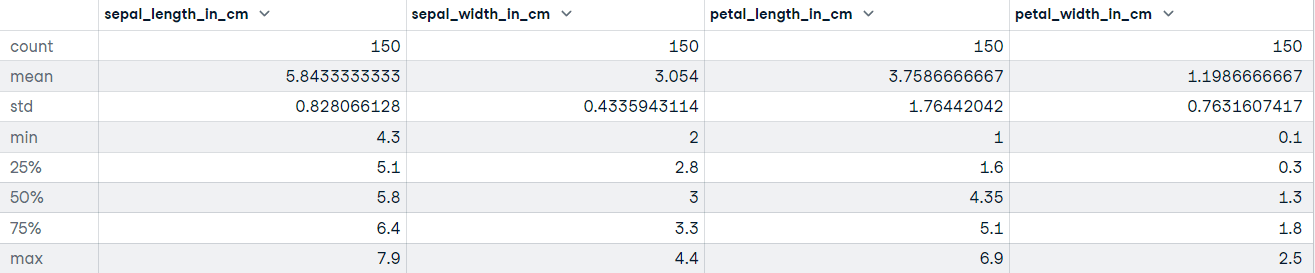
DataFrame.describe() generates descriptive statistics, including those that summarize the central tendency, dispersion, and shape of the dataset’s distribution. If your data has missing values, don’t worry; they are not included in the descriptive statistics.
Let’s call the describe method on the Iris dataset:
# Get descriptive statistics iris_data.describe()
Exporting the DataFrame to a CSV File
Another method available to pandas dataframe objects is to_csv(). When you have cleaned and preprocessed your data, the next step may be to export the dataframe to a file – this is pretty straightforward:
# Export the file to the current working directory iris_data.to_csv("cleaned_iris_data.csv")
Executing this code will create a CSV in the current working directory called cleaned_iris_data.csv.
But what if you want to use a different delimiter to mark the beginning and end of a unit of data or you wanted to specify how your missing values should be represented? Maybe you don’t want the headers to be exported to the file.
Well, you can adjust the parameters of the to_csv() method to suit your requirements for the data you want to export.
Let’s take a look at a few examples of how you can adjust the output of to_csv():
- Export data to the current working directory but using a tab delimiter.
# Change the delimiter to a tab iris_data.to_csv("tab_seperated_iris_data.csv", sep="\t")
- Exporting data without the index
# Export data without the index iris_data.to_csv("tab_seperated_iris_data.csv", sep="\t") # If you get UnicodeEncodeError use this... # iris_data.to_csv("tab_seperated_iris_data.csv", sep="\t", index=False, encoding='utf-8')
- Change the name of missing values (the default is ““)
# Replace missing values with "Unknown" iris_data.to_csv("tab_seperated_iris_data.csv", sep="\t", na_rep="Unknown")
- Export dataframe to file without headers (column names)
# Do not include headers when exporting the data iris_data.to_csv("tab_seperated_iris_data.csv", sep="\t", na_rep="Unknown", header=False)
Final thoughts
Let’s recap what we covered in this tutorial; you learned how to:
- Import a CSV file using the
read_csv()function from the pandas library. - Set a column index while reading your data into memory.
- Specify the columns in your data that you want the
read_csv()function to return. - Read data from a URL with the
pandas.read_csv() - Quickly gather insights about your data using methods and attributes on your dataframe object.
- Export a dataframe object to a CSV file
- Customize the output of the export file from the
to_csv()method.
In this tutorial, we focused solely on importing and exporting data from the perspective of a CSV file; you now have a good sense of how useful pandas is when importing and exporting CSV files. CSV is one of the most common data storage formats, but it’s not the only one. There are various other file formats used in data science, such as parquet, JSON, and excel.