Showing posts with label Machine Learning. Show all posts
What Is Streamlit?
Streamlit is a free and open-source framework to rapidly
build and share beautiful machine learning and data science web apps.
It is a Python-based library specifically designed for
machine learning engineers. Data scientists or machine learning engineers are
not web developers and they're not interested in spending weeks learning to use
these frameworks to build web apps. Instead, they want a tool that is easier to
learn and to use, as long as it can display data and collect needed parameters
for modeling.
Streamlit allows you to create a stunning-looking
application with only a few lines of code.

Why should data scientists use Streamlit?
The best thing about Streamlit is that you don't even need
to know the basics of web development to get started or to create your first
web application. So if you're somebody who's into data science and you want to
deploy your models easily, quickly, and with only a few lines of code,
Streamlit is a good fit.
One of the important aspects of making an application
successful is to deliver it with an effective and intuitive user interface.
Many of the modern data-heavy apps face the challenge of building an effective
user interface quickly, without taking complicated steps. Streamlit is a
promising open-source Python library, which enables developers to build
attractive user interfaces in no time.
Streamlit is the easiest way especially for people with no
front-end knowledge to put their code into a web application:
- No
front-end (html, js, css) experience or knowledge is required.
- You
don't need to spend days or months to create a web app, you can create a
really beautiful machine learning or data science app in only a few hours
or even minutes.
- It is
compatible with the majority of Python libraries (e.g. pandas, matplotlib,
seaborn, plotly, Keras, PyTorch, SymPy(latex)).
- Less
code is needed to create amazing web apps.
- Data
caching simplifies and speeds up computation pipelines.
How to use Streamlit
Install Streamlit
On Windows:
1. Install Anaconda and create your environment
2. Open the terminal

3. Type this command in the terminal to install Streamlit:
pip install streamlit
4. Test if the installation worked:
streamlit hello

When you type this command in the terminal, the page below
should open automatically:

On macOS:
1. Install pip:
sudo easy_install pip
2. Install pipenv:
pip3 install pipenv
3. Create your environment. Open your project folder:
cd project_folder_name
4. Create a pipenv environment:
pipenv shell
5. Type this command to install Streamlit:
pip install streamlit
Test if the installation worked:
streamlit hello
On Linux:
1. Install pip:
sudo apt-get install python3-pip
2. Install pipenv:
pip3 install pipenv
3. Create your environment. Open your project folder:
cd project_folder_name
4. Create a pipenv environment:
pipenv shell
5. Type this command to install Streamlit
pip install streamlit
6. Test if the installation worked:
streamlit hello
How to run your Streamlit code
streamlit run file_name.py

Streamlit commands are easy to write and understand. With
just a simple command, you are able to display texts, media, widgets, graphs,
etc.
Display texts with Streamlit
In the beginning, we will see how to add text to your
Streamlit app, and what the different commands are to add texts.
st.write(): This function is used to add anything to a web
app, from formatted string to charts in matplotlib figure, Altair charts,
plotly figure, data frame, Keras model, and others.
import streamlit as stst.write("Hello ,let's learn how
to build a streamlit app together")

st.title(): This function allows you to add the title of the
app. st.header(): This function is used to set header of a section. st.markdown():
This function is used to set a markdown of a section. st.subheader(): This
function is used to set sub-header of a section. st.caption(): This
function is used to write caption. st.code(): This function is used to set
a code. st.latex(): This function is used to display mathematical
expressions formatted as LaTeX.
import streamlit as st
st.title("This is the app title")
st.header("This is the header")
st.markdown("This is the markdown")
st.subheader("This is the subheader")
st.caption("This is the caption")
st.code("x
= 2021")
st.latex(r'''
a+a r^1+a r^2+a r^3 ''')

Display an image, video or audio file with Streamlit
You can't find functions as easy as Streamlit functions to
display images, videos, and audio files. Let's take a look at how to display
media with Streamlit !
st.image(): This function is used to display an image. st.audio():
This function is used to display an audio. st.video(): This function is
used to display a video.
st.image("kid.jpg", caption="A kid
playing")
st.audio("audio.mp3")
st.video("video.mp4")

Input widgets
Widgets are the most important user interface components.
Streamlit has various widgets that allow you to bake interactivity directly
into your apps with buttons, sliders, text inputs, and more.
st.checkbox(): This function returns a Boolean value. When
the box is checked, it returns a True value, otherwise a False value. st.button():
This function is used to display a button widget. st.radio(): This
function is used to display a radio button widget. st.selectbox(): This
function is used to display a select widget. st.multiselect(): This
function is used to display a multiselect widget. st.select_slider(): This
function is used to display a select slider widget. st.slider(): This
function is used to display a slider widget.
st.checkbox('Yes')
st.button('Click Me')
st.radio('Pick your gender', ['Male', 'Female'])
st.selectbox('Pick a fruit', ['Apple', 'Banana', 'Orange'])
st.multiselect('Choose a planet', ['Jupiter', 'Mars', 'Neptune'])
st.select_slider('Pick a mark', ['Bad', 'Good', 'Excellent'])
st.slider('Pick a number', 0, 50)

st.number_input(): This function is used to display a
numeric input widget. st.text_input(): This function is used to display a
text input widget. st.date_input(): This function is used to display a
date input widget to choose a date. st.time_input(): This function is used
to display a time input widget to choose a time. st.text_area(): This
function is used to display a text input widget with more than a line
text. st.file_uploader(): This function is used to display a file uploader
widget. st.color_picker(): This function is used to display color picker
widget to choose a color.
st.number_input('Pick a number', 0, 10)
st.text_input('Email address')
st.date_input('Traveling date')
st.time_input('School time')
st.text_area('Description')
st.file_uploader('Upload a photo')
st.color_picker('Choose your favorite color')

Display progress and status with Streamlit
Now we will see how we can add a progress bar and status
messages such as error and success to our app.
st.balloons(): This function is used to display balloons for
celebration. st.progress(): This function is used to display a progress
bar. st.spinner(): This function is used to display a temporary waiting
message during execution.
st.balloons() #
Celebration balloons
st.progress(10) #
Progress bar
with st.spinner('Wait for it...'):
time.sleep(10) # Simulating a process delay

st.success(): This function is used to display a success
message. st.error(): This function is used to display an error
message. st.warnig(): This function is used to display a warning
message. st.info(): This function is used to display an informational
message. st.exception(): This function is used to display an exception
message.
st.success("You did it!")
st.error("Error occurred")
st.warning("This is a warning")
st.info("It's easy to build a Streamlit app")
st.exception(RuntimeError("RuntimeError exception"))

Sidebar and container
You can also create a sidebar or a container on your page to
organize your app. The hierarchy and arrangement of pages on your app can have
a large impact on your user experience. By organizing your content, you allow
visitors to understand and navigate your site, which helps them find what
they're looking for and increases the likelihood that they'll return in the
future.
Sidebar
Passing an element to st.sidebar() will make this
element pinned to the left, allowing users to focus on the content in your app.
But st.spinner() and st.echo() are not
supported with st.sidebar.
As you see, you can create a sidebar in your app interface
and put elements inside it that will make your app more organized and easier to
understand.
st.sidebar.title("Sidebar Title")
st.sidebar.markdown("This is the sidebar content")

Container
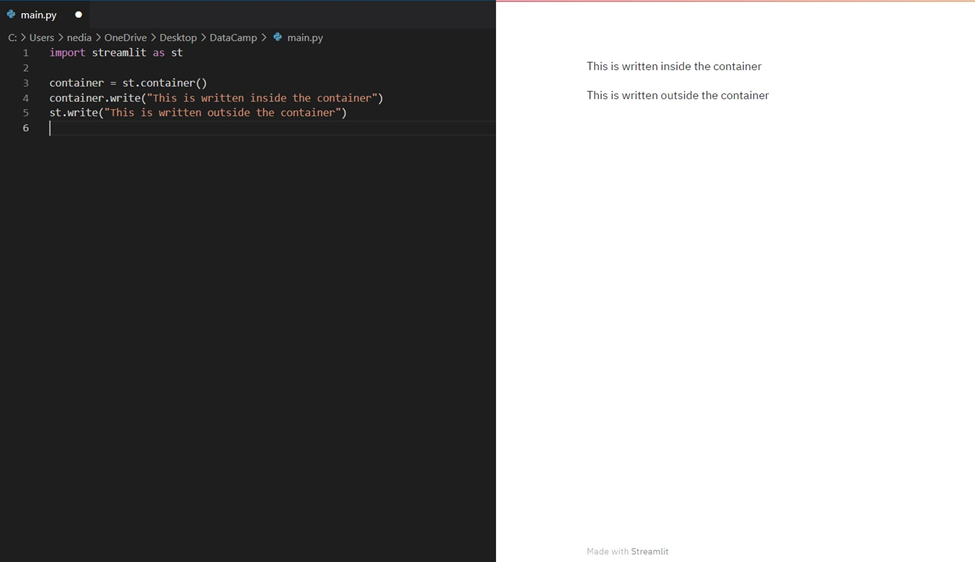
st.container() is used to create an invisible container
where you can put elements in order to create a useful arrangement and
hierarchy.
with st.container():
st.write("This
is inside the container")
Display graphs with Streamlit
Why do we need visualization?
Data visualization helps to tell stories by curating data
into a format that's easier to understand, highlighting the trends and
outliers. A good visualization tells a story, removing the noise from data and
highlighting the useful information. However, it's not simply as easy as
dressing up a graph to make it look better or slapping on the "info"
part of an infographic. Effective data visualization is a delicate balancing
act between form and function. The plainest graph could be too boring to draw
attention or convey a powerful message, and the most stunning visualization
could utterly fail at conveying the right message. The data and the visuals
need to work together, and there's an art to combining great analysis with
great storytelling.
Do you think giving you the data of one million points in a
table/database file and asking you to provide your inferences by just seeing
the data on that table is feasible? Unless you're a super human, it's not
possible. This is when we make use of data visualization—it gives us a clear
idea of what the information means by giving it visual context through maps or
graphs. That's the power of Streamlit visualization.
st.pyplot(): This function is used to display a
matplotlib.pyplot figure.
import streamlit as st
import matplotlib.pyplot as plt
import numpy as np
rand = np.random.normal(1, 2, size=20)
fig, ax = plt.subplots()
ax.hist(rand, bins=15)
st.pyplot(fig)

st.line_chart(): This function is used to display a line
chart.
import streamlit as st
import pandas as pd
import numpy as np
df = pd.DataFrame(np.random.randn(10, 2), columns=['x', 'y'])
st.line_chart(df)

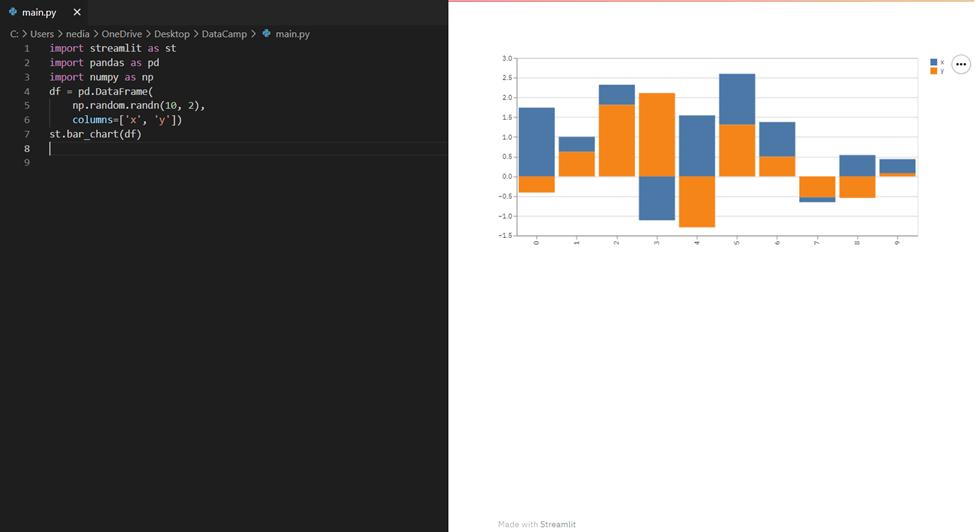
st.bar_chart(): This function is used to display a bar
chart.
import streamlit as st
import pandas as pd
import numpy as np
df = pd.DataFrame(np.random.randn(10, 2), columns=['x', 'y'])
st.bar_chart(df)
st.area_chart(): This function is used to display an area
chart.
import streamlit as st
import pandas as pd
import numpy as np
df = pd.DataFrame(np.random.randn(10, 2), columns=['x', 'y'])
st.area_chart(df)

st.altair_chart(): This function is used to display an
altair chart.
import streamlit as st
import pandas as pd
import numpy as np
import altair as alt
df = pd.DataFrame(np.random.randn(500, 3), columns=['x', 'y',
'z'])
chart = alt.Chart(df).mark_circle().encode(
x='x', y='y', size='z',
color='z', tooltip=['x', 'y', 'z']
)
st.altair_chart(chart, use_container_width=True)

st.graphviz_chart(): This function is used to display graph
objects, which can be completed using different nodes and edges.
import streamlit as st
import graphviz
st.graphviz_chart('''
digraph {
Big_shark
-> Tuna
Tuna ->
Mackerel
Mackerel ->
Small_fishes
Small_fishes
-> Shrimp
}
''')

Display maps with Streamlit
st.map(): This function is used to display maps in the app.
However, it requires the values of latitude and longitude and these values
should not be null/NA.
import pandas as pd
import numpy as np
import streamlit as st
df = pd.DataFrame(
np.random.randn(500,
2) / [50, 50] + [37.76, -122.4], columns=['lat', 'lon']
)
st.map(df)

Themes
You can also choose a theme that reflects your style. Follow
the steps in the GIF below:
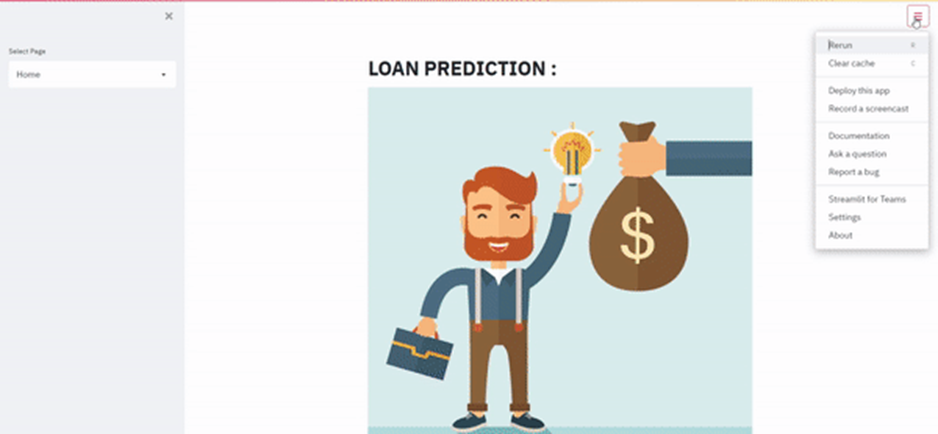
And if you are interested in learning more about styling and
themes, you can take a look at Theming.
Now, it's time to build an app together!
Build a machine learning application
In this section, I will walk you through a project I made
about loan prediction.
The main profit of loans comes directly from the loan's
interest. The loan companies grant a loan after an intensive process of
verification and validation. However, they still don't have assurance if the
applicant is able to repay the loan with no difficulties. In this tutorial, we
will build a predictive model (Random Forest Classifier) to predict the loan
status of an applicant. Our mission is to prepare a web app to make it
available in production.
Starting with importing the necessary libraries for our app:
import streamlit as st
import pandas as pd
import numpy as np
import pickle # to
load a saved model
import base64 # to
handle gif encoding
In this app, we will use multiple widgets as sliders:
selectbox and radio in the sidebar menu, for which we will prepare some Python
functions.The example will be a simple demo that has two pages. On the
homepage, it will show the data that we selected, whereas the Exploration page
will allow you to visualize variables in plots, and the Prediction page will
contain variables with a button named Predict that will allow you to estimate
the loan status. The code below gives you a selectbox on the sidebar which
allows you to select a page. The data is cached so that it does not need to
reload constantly.
@st.cache is a caching mechanism that allows your app
to stay performant even when loading data from the web, manipulating large
datasets, or performing expensive computations.
@st.cache
def get_fvalue(val):
feature_dict = {"No":
1, "Yes": 2}
return
feature_dict[val]
def get_value(val, my_dict):
return my_dict[val]

In the Home page, we will visualize: presentation picture /
the dataset / histogram of applicant income and loan amount.
Note: We will use if/elif/else to switch between pages.
We will load the loan_dataset.csv in variable data that will
allow us to show a few lines of it in the Home page.
if app_mode == 'Home':
st.title('Loan
Prediction')
st.image('loan_image.jpg')
st.markdown('Dataset:')
data = pd.read_csv('loan_dataset.csv')
st.write(data.head())
st.bar_chart(data[['ApplicantIncome',
'LoanAmount']].head(20))

Then in the Prediction page:
if app_mode == 'Prediction':
ApplicantIncome =
st.sidebar.slider('ApplicantIncome', 0, 10000, 0)
LoanAmount = st.sidebar.slider('LoanAmount
in K$', 9.0, 700.0, 200.0)
# Assuming
additional input features here...
# Prediction Logic
if st.button("Predict"):
loaded_model =
pickle.load(open('Random_Forest.sav', 'rb'))
prediction =
loaded_model.predict(np.array([ApplicantIncome, LoanAmount]).reshape(1, -1))
if prediction[0]
== 0:
st.error('According
to our calculations, you will not get the loan.')
else:
st.success('Congratulations!
You will get the loan.')
We wrote two functions get_value(val,my_dict) and get_fvalue(val) and
dictionaries as feature_dict to manipulate st.sidebar.radio() with
non-numeric variables. It's optional, you can easily do something like this:

Let's see why we did that.
Note: Machine learning algorithms cannot handle categorical
variables. In the dataset, I did some feature engineering. For example, the
column Married has two variables 'Yes' and 'No' and I did a Label Encoding (
Take a look to better understand ) so "NO" will be equal to 1 and
"Yes" to 2. The function get_fvalue(val) will easily return the value
(1/2) depending what the client has chosen. Same for the function
get_value(val,my_dict) . The difference between the two functions is that the
first works on yes/no features and the second one is in the general case when
we have multiple variables ( example: Gender ).
As we can see the variable Dependents has four categories
'0','1' , '2' and '3+' and we cannot convert something like that into a numeric
variable, and we have '+3' that means Dependents can take 3,4,5 ... We did a
One Hot Enconding ( Take a look to better understand ) Thus , we created a
sidebar radio containing the four elements and each one has a binary variable,
if the client chose '0' class_0 will be equal to 1 and the others will be equal
to 0.

Also we did One Hot Encoding for Property_Area that's why we
created 3 variables (Rural,Urban,Semiurban) ,When Rural takes 1 the others will
be equal to 0.

So we have seen both—when we label or one hot encoding our
features and how to deal with it to successfully created a working Streamlit
app.
data1={ 'Gender':Gender, 'Married':Married, 'Dependents':[class_0,class_1,class_2,class_3], 'Education':Education, 'ApplicantIncome':ApplicantIncome, 'CoapplicantIncome':CoapplicantIncome, 'Self Employed':Self_Employed, 'LoanAmount':LoanAmount, 'Loan_Amount_Term':Loan_Amount_Term, 'Credit_History':Credit_History, 'Property_Area':[Rural,Urban,Semiurban], }
feature_list=[ApplicantIncome,CoapplicantIncome,LoanAmount,Loan_Amount_Term,Credit_History,get_value(Gender,gender_dict),get_fvalue(Married),data1['Dependents'][0],data1['Dependents'][1],data1['Dependents'][2],data1['Dependents'][3],get_value(Education,edu),get_fvalue(Self_Employed),data1['Property_Area'][0],data1['Property_Area'][1],data1['Property_Area'][2]] single_sample = np.array(feature_list).reshape(1,-1)
Now we will store our variables in a dictionary because we
wrote get_value(val,my_dict) and get_fvalue(val) to deal
with dictionaries. After that, the input—what the client will choose as input
in our Streamlit app—will be arranged in a list named feature_list then
to a numpy variable named single_sample.
Note: The inputs of features must be arranged in the same
order of dataset columns (e.g. Married cannot take the input of Gender).
if st.button("Predict"): file_ = open("6m-rain.gif", "rb") contents = file_.read() data_url = base64.b64encode(contents).decode("utf-8") file_.close() file
= open("green-cola-no.gif", "rb") contents = file.read() data_url_no = base64.b64encode(contents).decode("utf-8") file.close() loaded_model = pickle.load(open('Random_Forest.sav',
'rb')) prediction = loaded_model.predict(single_sample) if prediction[0] == 0 : st.error( 'According to our Calculations, you will
not get the loan from Bank' ) st.markdown( f'<img src="data:image/gif;base64,{data_url_no}"
alt="cat gif">',
unsafe_allow_html=True,) elif
prediction[0] == 1 : st.success( 'Congratulations!! you will get the loan
from Bank' ) st.markdown( f'<img src="data:image/gif;base64,{data_url}"
alt="cat gif">',
unsafe_allow_html=True, )
Finally, we will load our saved RandomForestClassifier model
in loaded_model and its prediction, which is 0 or 1 (classification
problem) in prediction. The .gif files will be stored in file and file_.
Depending on the value of prediction, we will have two cases,
"Success" or "Failed," to get a loan from the bank.
This is our Prediction page:

In the case of FAILURE, the output will look like this:

In the case of SUCCESS, the output will look like this:

How to use Streamlit Python with solving machine Learning Problem

- Input Signal
- Weight
- Bias
- Function
- Activate Function
- Output


Y= Ax +b
Simple Math behind Neural Networks
The machine learning paradigm is one where you have data, that data is labeled, and you want to figure out the rules that match the data to the labels. The simplest possible scenario to show this in code is as follows. Consider these two sets of numbers:
X = –1, 0, 1, 2, 3, 4
Y = –3, –1, 1, 3, 5, 7
There’s a relationship between the X and Y values (for
example, if X is –1 then Y is –3, if X is 3 then Y is 5, and so on). Can you
see it?
Here’s the full code, using the TensorFlow Keras
APIs. Don’t worry if it doesn’t make sense yet; we’ll go through it line by
line:
import tensorflow as tfimport numpy as npfrom tensorflow.keras import Sequentialfrom tensorflow.keras.layers import Dense model = Sequential([Dense(units=1, input_shape=[1])])model.compile(optimizer='sgd', loss='mean_squared_error') xs = np.array([-1.0, 0.0, 1.0, 2.0, 3.0, 4.0], dtype=float)ys = np.array([-3.0, -1.0, 1.0, 3.0, 5.0, 7.0], dtype=float) model.fit(xs, ys, epochs=500) print(model.predict([10.0]))

When using
TensorFlow, you define your layers using Sequential. Inside the Sequential, you then specify what
each layer looks like. We only have one line inside our Sequential, so we have only one layer.
You
then define what the layer looks like using the keras.layers API. There are lots
of different layer types, but here we’re using a Dense layer. “Dense” means
a set of fully (or densely) connected neurons,
you have to
tell it what the shape of the input data is. In this case our input data is our
X, which is just a single value, so we specify that that’s its shape.
The next line is where the fun really begins. Let’s look at it
again:
If
you’ve done anything with machine learning before, you’ve probably seen that it
involves a lot of mathematics.
Armed with this knowledge, the computer can then make another guess.
That’s the job of the optimizer. This is where the heavy calculus is used,
but with TensorFlow, that can be hidden from you. You just pick the appropriate
optimizer to use for different scenarios. In this case we picked one called sgd
Next, we simply format our numbers into the data format that the
layers expect. In Python, there’s a library called Numpy that TensorFlow
can use, and here we put our numbers into a Numpy array to make it easy to
process them:
ys = np.array([-3.0, -1.0, 1.0, 3.0, 5.0, 7.0], dtype=float)The learning process will then begin with the model.fit command, like this:
You
can read this as “fit the Xs to the Ys, and try it 500 times.” So, on the first
try, the computer will guess the relationship (i.e., something like Y = 10X +
10),
Our last line of code then used the trained model to get a
prediction like this:

Run the code for yourself to see what you get.
I got 18.977888 when I ran it, but your answer may differ slightly because when
the neural network is first initialized there’s a random element: your initial
guess will be slightly different from mine, and from a third person’s.